
Trade Breakdown – ZETA (5-Minute Chart) | 11/21/25
Yesterday I took a setup on ZETA as it was trading right at a 3-month support level. This stock popped up on my AI scanners as a strong swing trade candidate, and Ive already done the research on the company and have high conviction its going higher.
Yesterday I took a setup on ZETA as it was trading right at a 3-month support level. This stock popped up on my AI scanners as a strong swing trade candidate, and Ive already done the research on the company and have high conviction its going higher.
The market opened soft, and after the NVDA-driven reversal the day before, I was expecting a bounce.
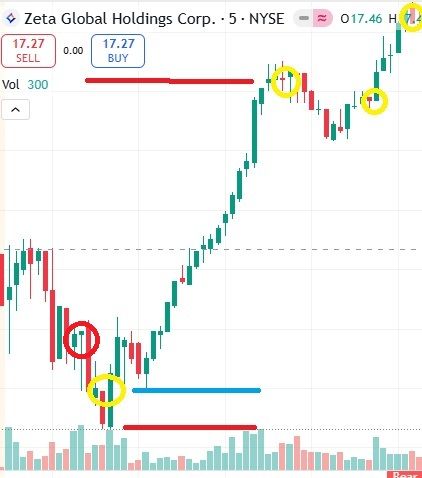
My first entry was a false breakout (circled in red). We got a green candle breaking above the prior one with a strong volume surge. With those big hammer candle wicks, it looked like the breakout was ready—but it failed immediately and hit my stop, which I had placed at the bottom of the last green candle body. Small loss.
About 15 minutes later, I took another shot (circled in yellow). Volume spiked again, and we got a clean green candle breakout over the previous two candles. I set my stop at the bottom of the last red candle. It ran hard at first, then began to pull back. I moved my stop to breakeven and watched the consolidation, which ended up forming a classic bull flag. After that, we started printing consistent green-over-green candles. I kept trailing my stop under each prior 5-minute green candle. Two green dojis printed at the top, signaling exhaustion, and when the first red doji broke under the last green candle, my stop got hit. Solid trade.
I watched for another 30 minutes and took one more small trade to the short side. Overall, a good day.
I also traded NVDA and JOBY, but both had a lot of volatility and messy price action—lots of sharp wicks and micro pullbacks—so even though the gains were positive, they required nearly 50 entries/exits combined.
After one of the roughest weeks we’ve had in a while, I’m thinking next week could offer a clean rebound. We’ll see.